~/work/fleet-management-system · Custom software
National Fleet Management System, Dashboard UX and Front-End
Overview
A national fleet-management system for 580+ vehicles across 12+ cities in Pakistan. Live tracking, drivers, fuel, maintenance, insurance and emergency jobs live in one platform, with role-based access from regional heads down to drivers.
The challenge
Fleet data was split across spreadsheets, phone calls and paper logs. Head office could not see where vehicles were, fuel losses went unnoticed, and every role needed a different view of the same operation.
problem / solution
What we set out to fix
Problem
- No live view of where 580+ vehicles were, or why they had stopped.
- Fuel anomalies and maintenance were caught late, on paper.
- Regional heads, supervisors, technicians and drivers shared one blunt view.
Solution
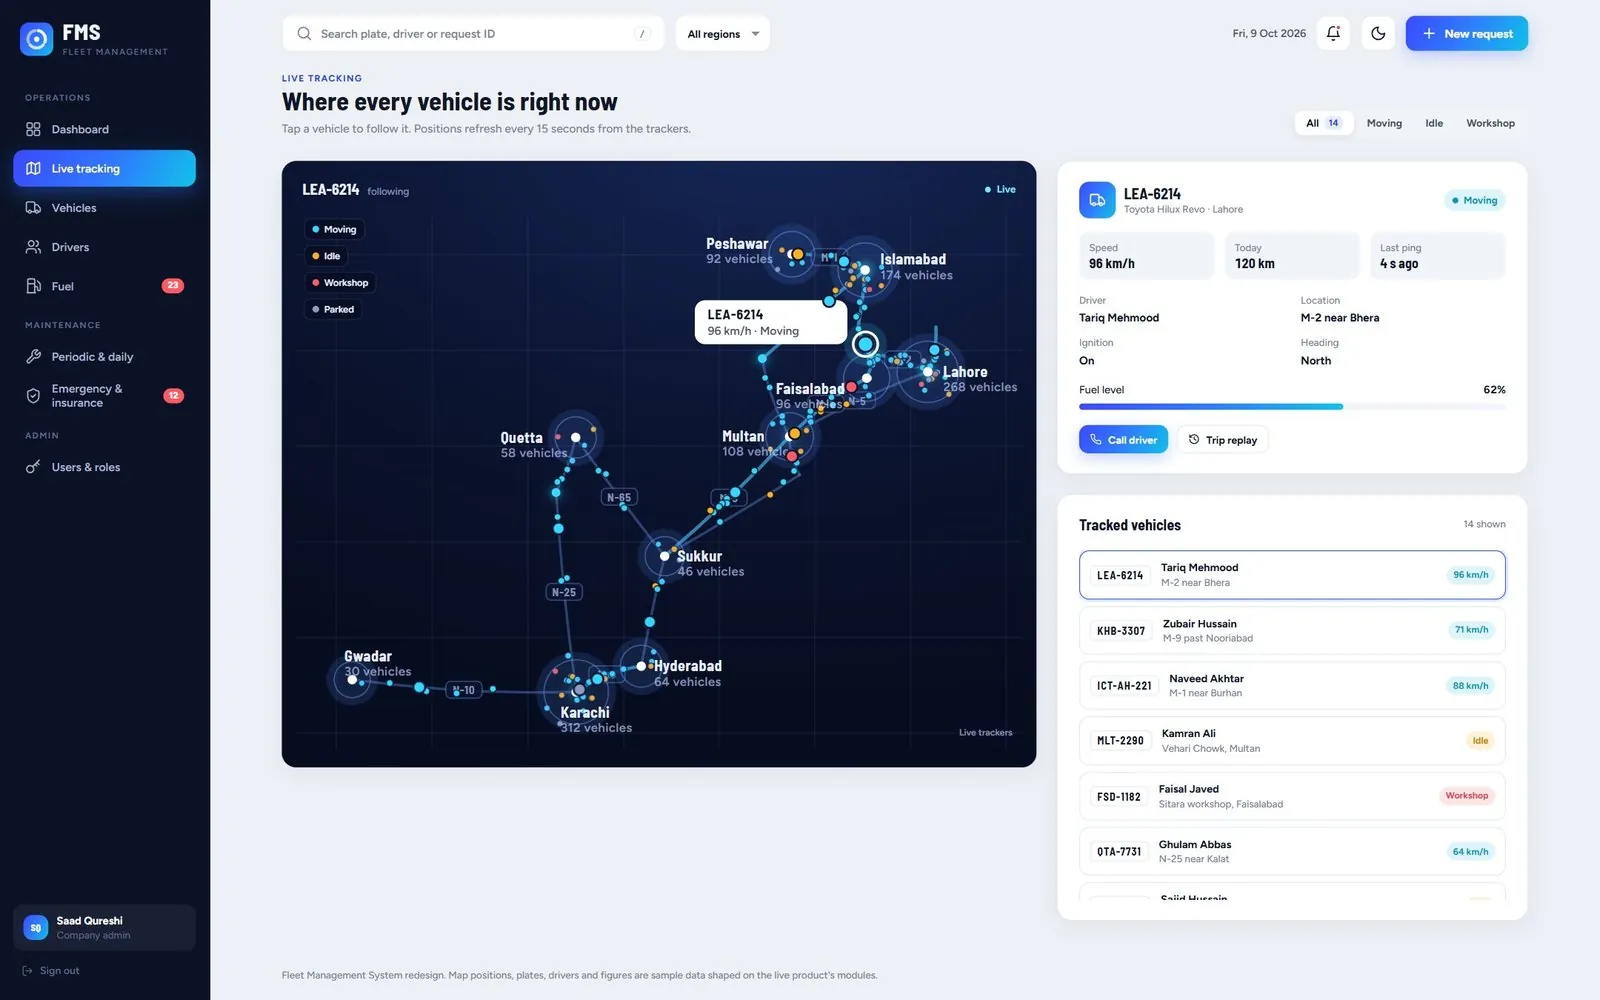
- Live tracking, filterable by moving, idle, workshop or parked.
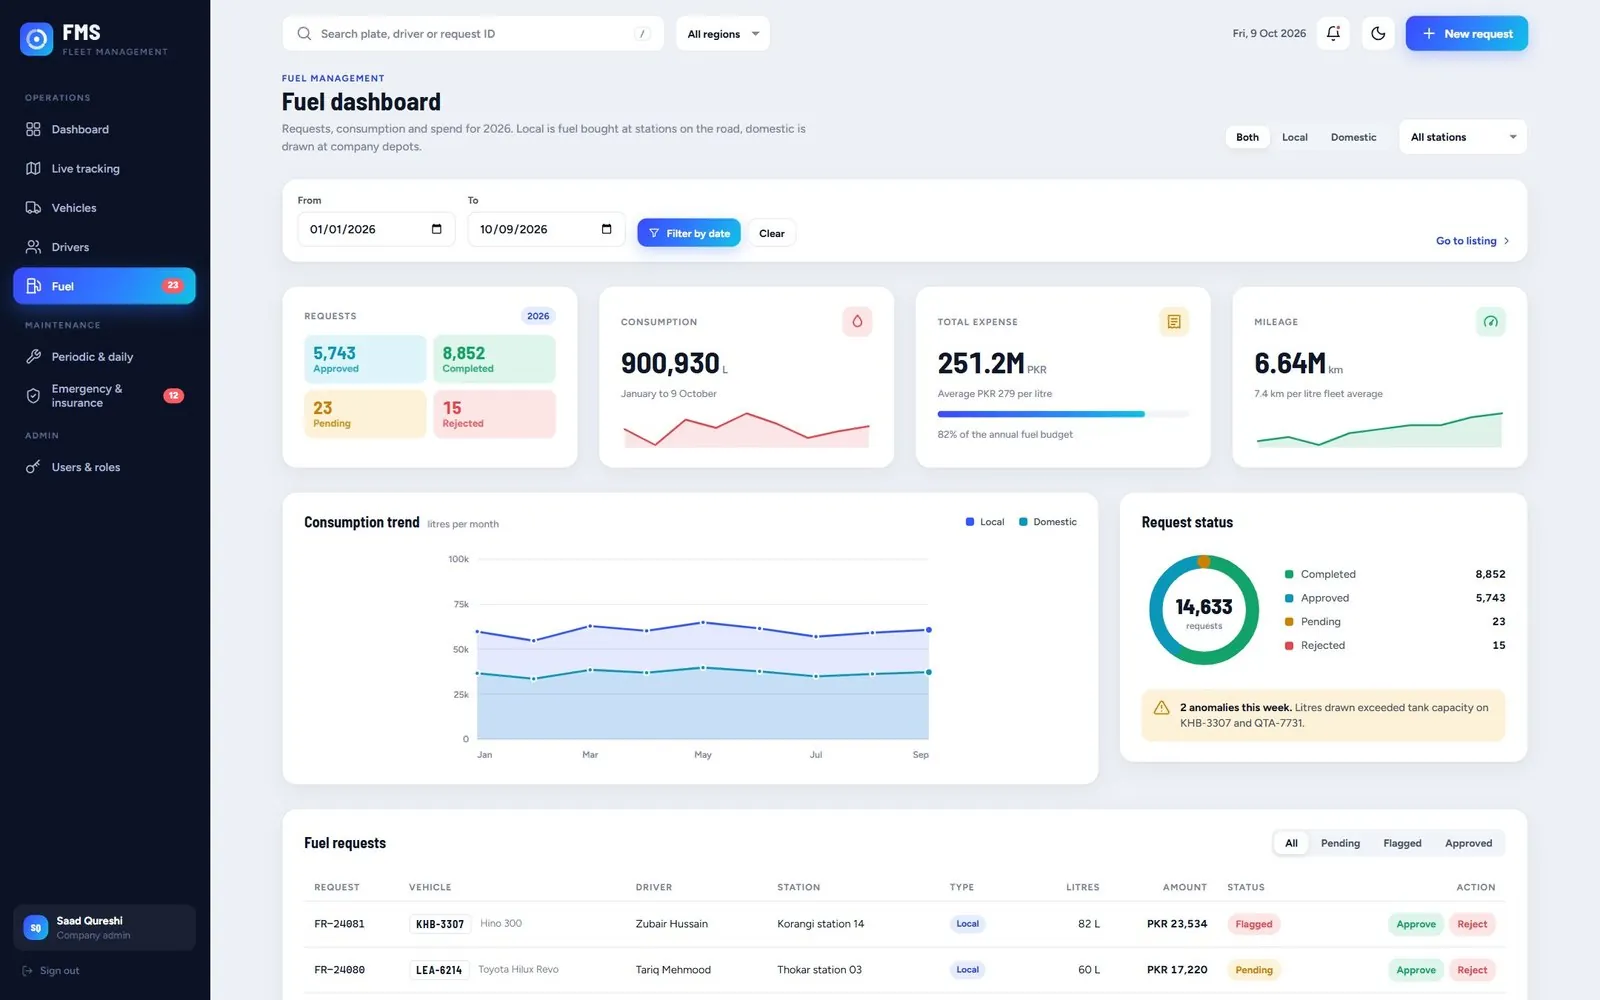
- Fuel logs with anomaly flags and cost per litre.
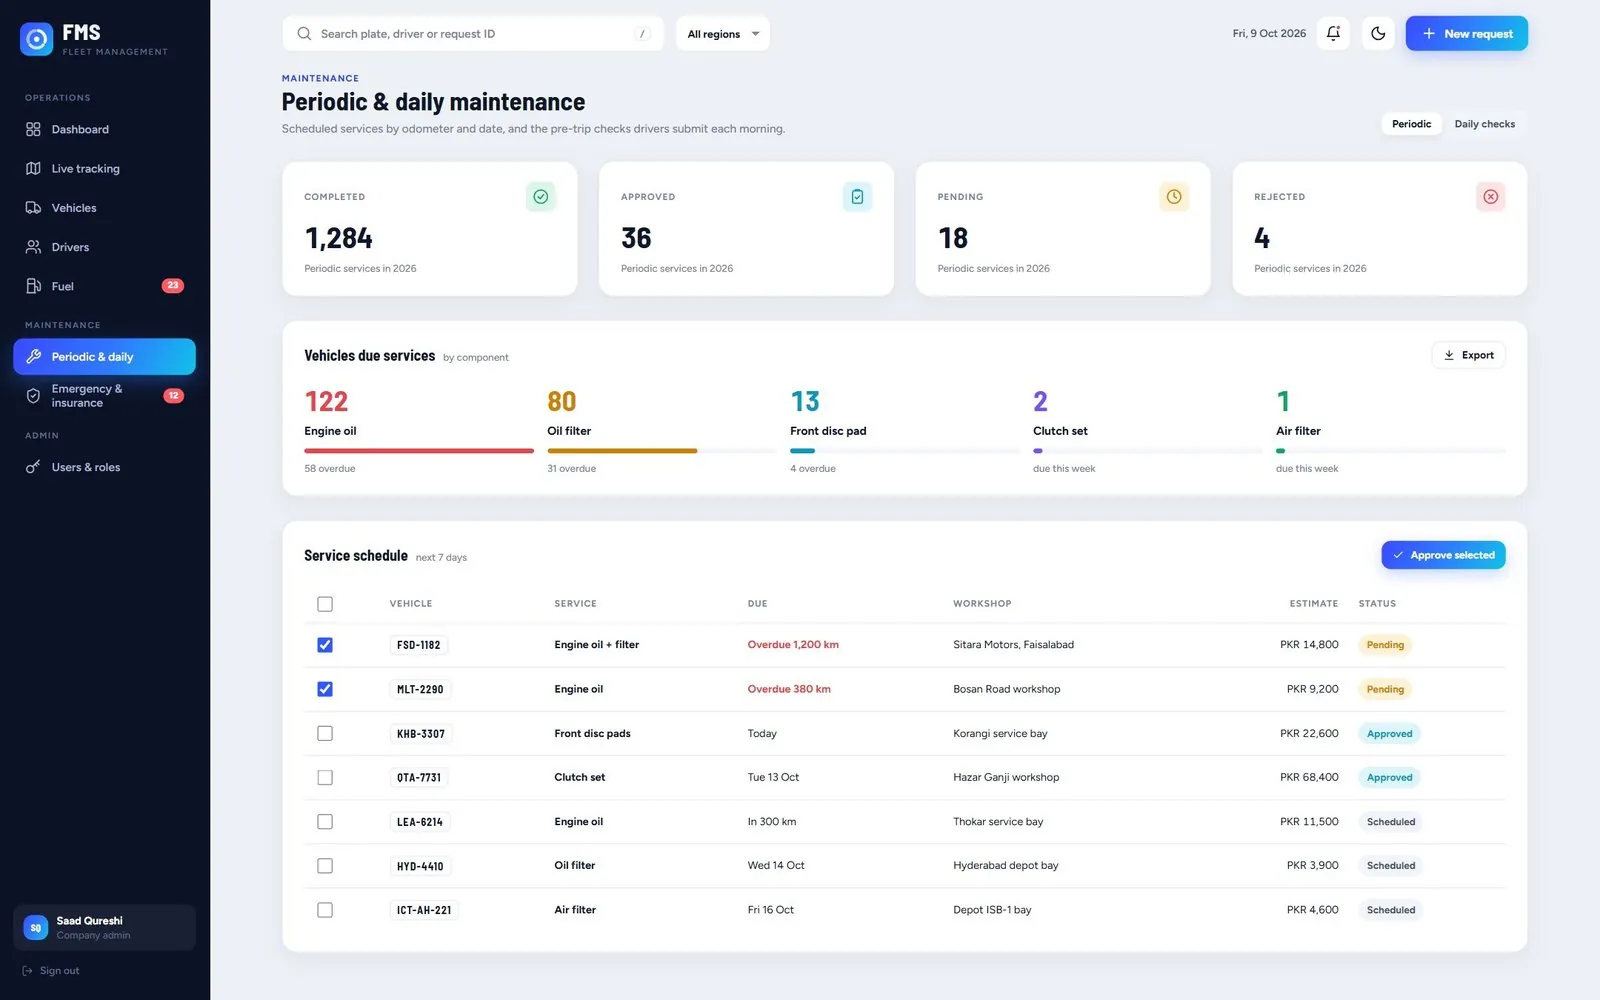
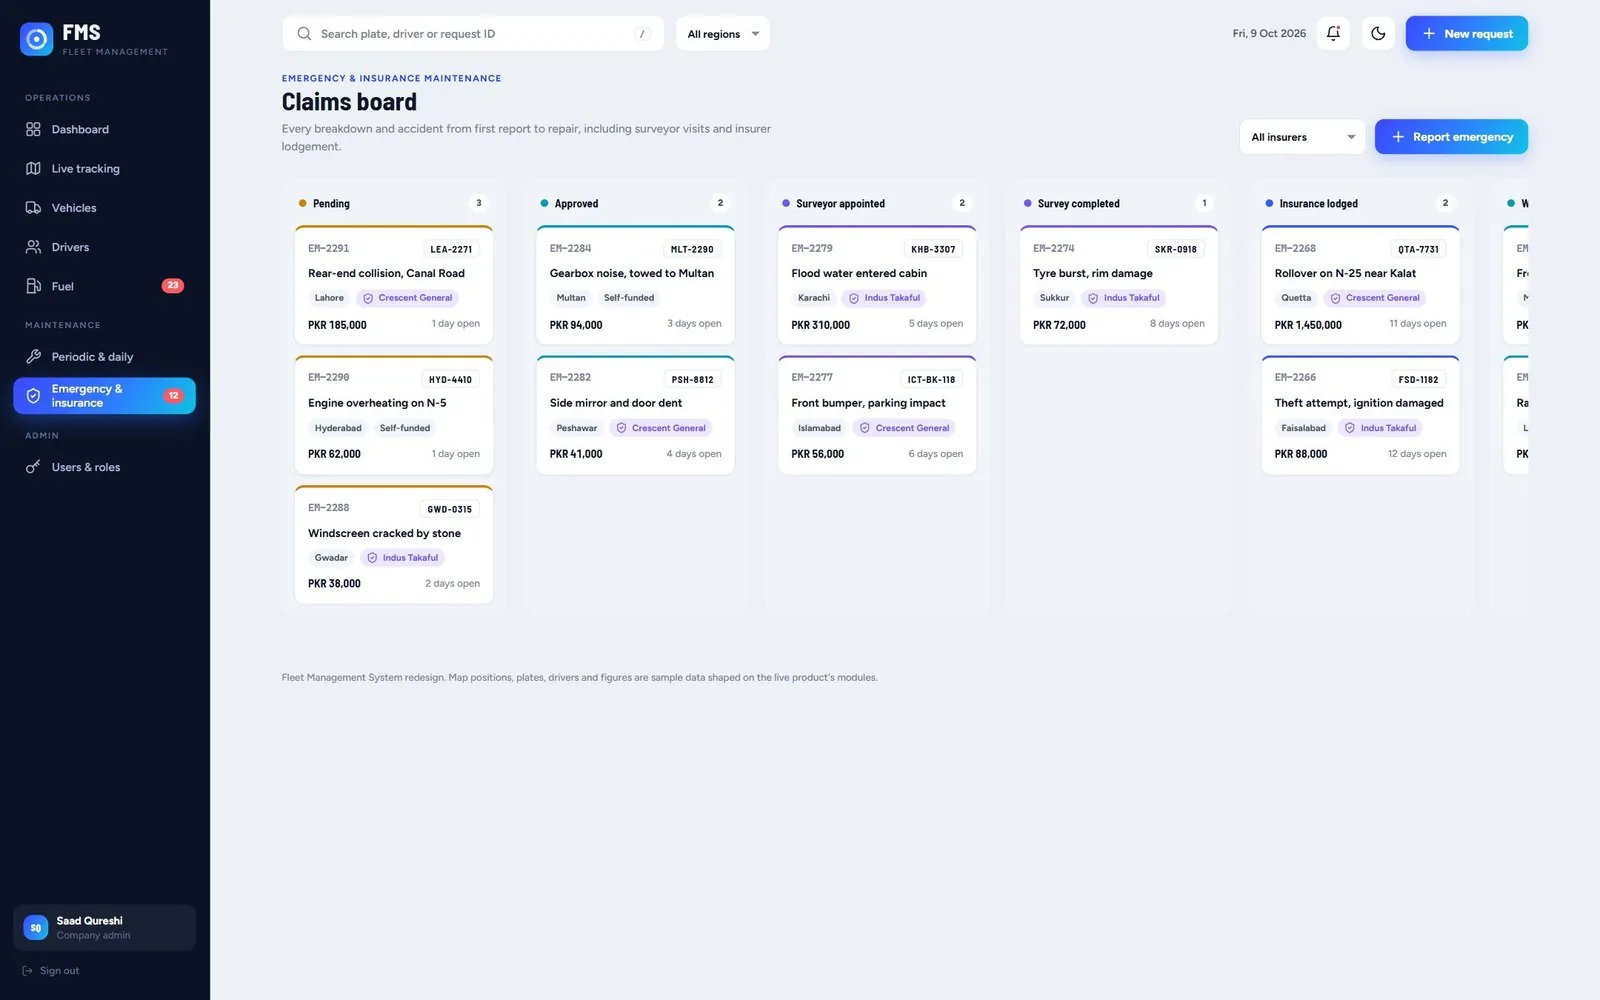
- Scheduled maintenance, emergency jobs and insurance to closure.
- Role-based access for four regional heads and every team.
process
How we built it
01
Research
Mapped how the fleet runs day to day: dispatch, fuel, workshops and incidents.
02
UX design
Designed one dashboard per role over a shared data model.
03
UI design
A dense, calm interface: condensed numbers, clear status colours.
04
Build
React and Next.js on Node.js, MySQL and Prisma, with real-time APIs.
features
What it does
feature 01
Every vehicle, live
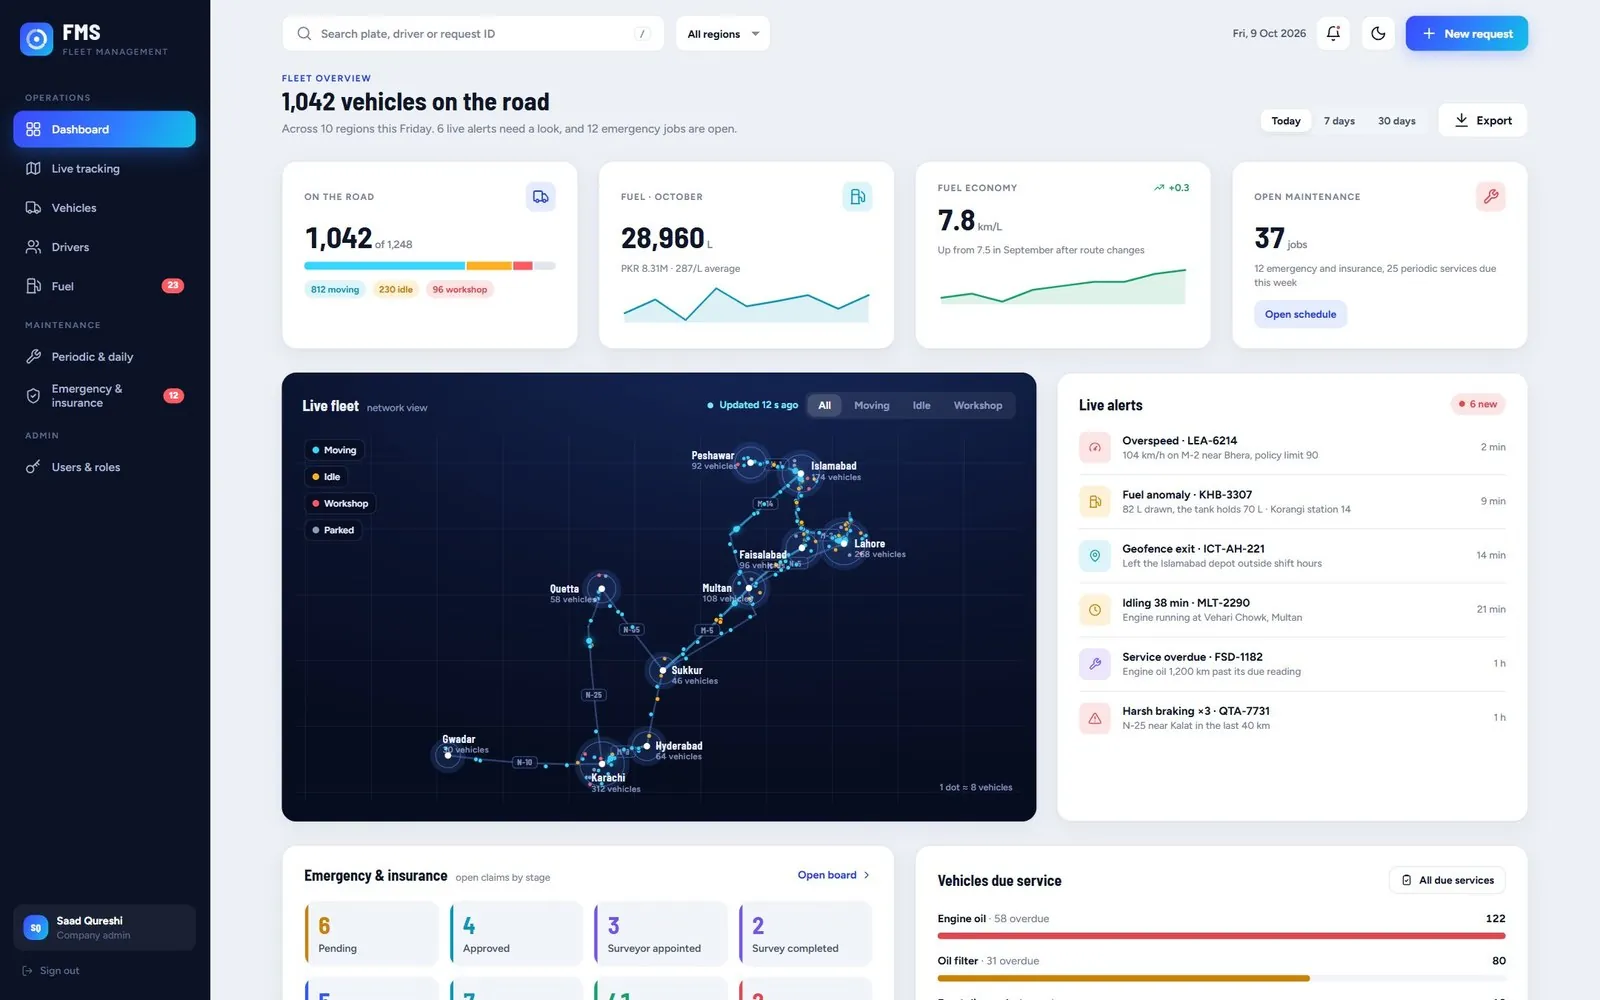
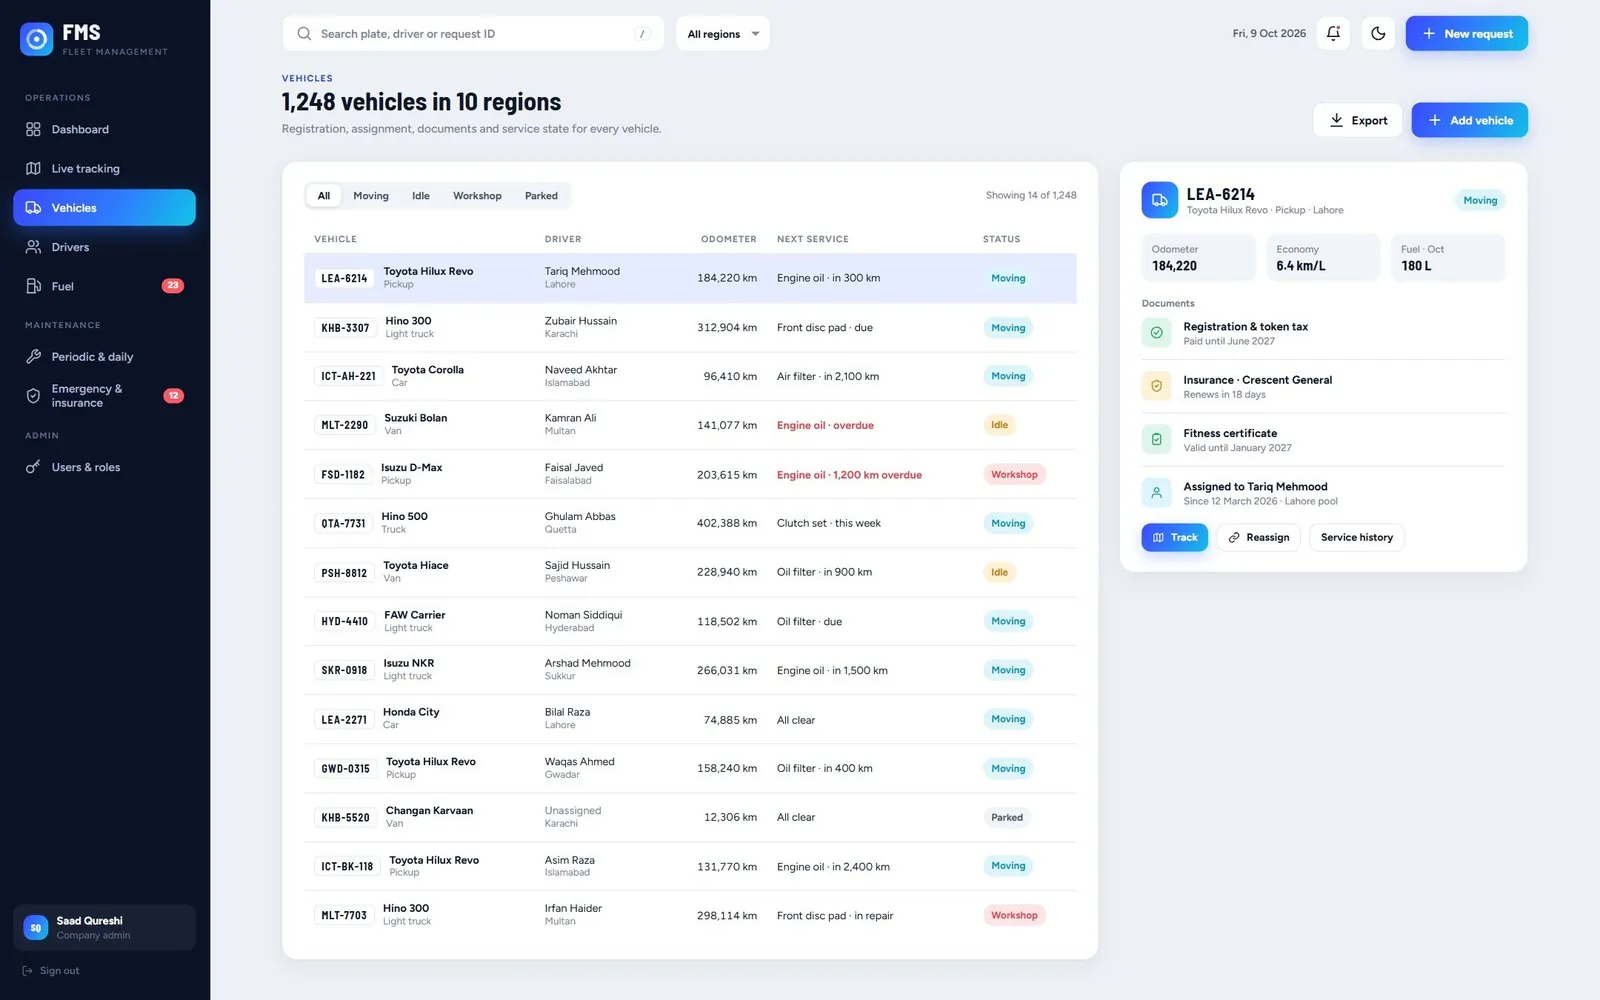
- Vehicles on the road, fuel, economy and open maintenance with live alerts.
- Every vehicle on a live map, filterable by status.
feature 02
Fuel and upkeep, under control
- Fuel logs per vehicle with anomaly flags and cost per litre.
- Periodic and daily maintenance schedules with full job history.
feature 03
The right view for every role
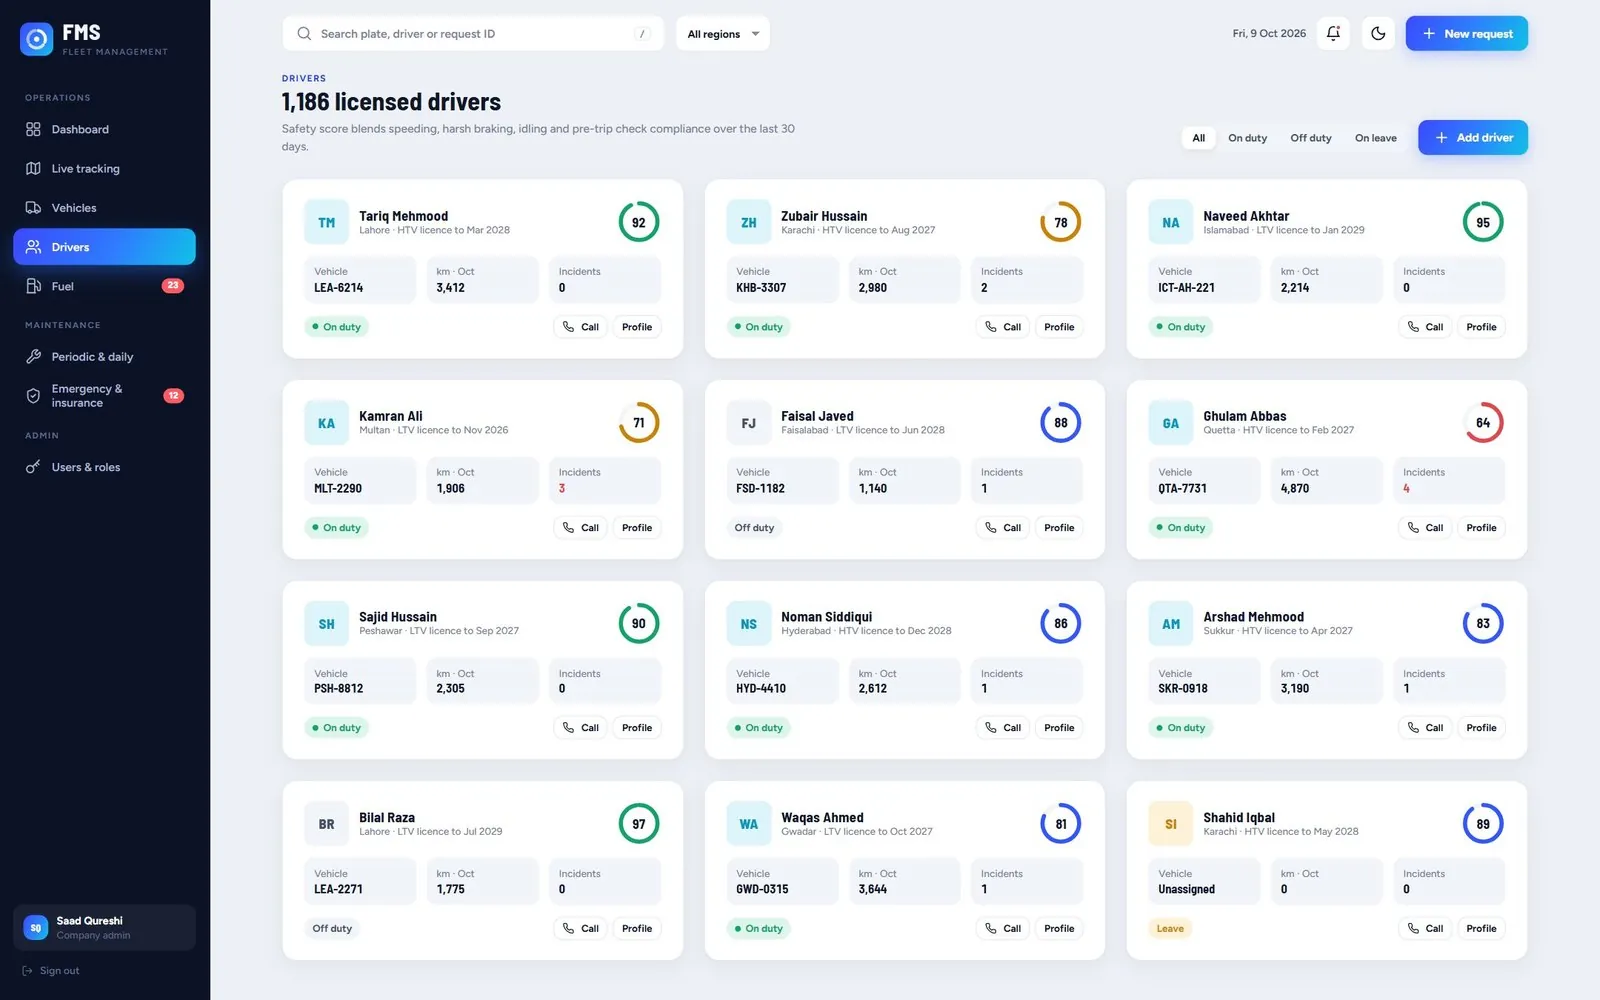
- Driver profiles, licences, scores and current assignments.
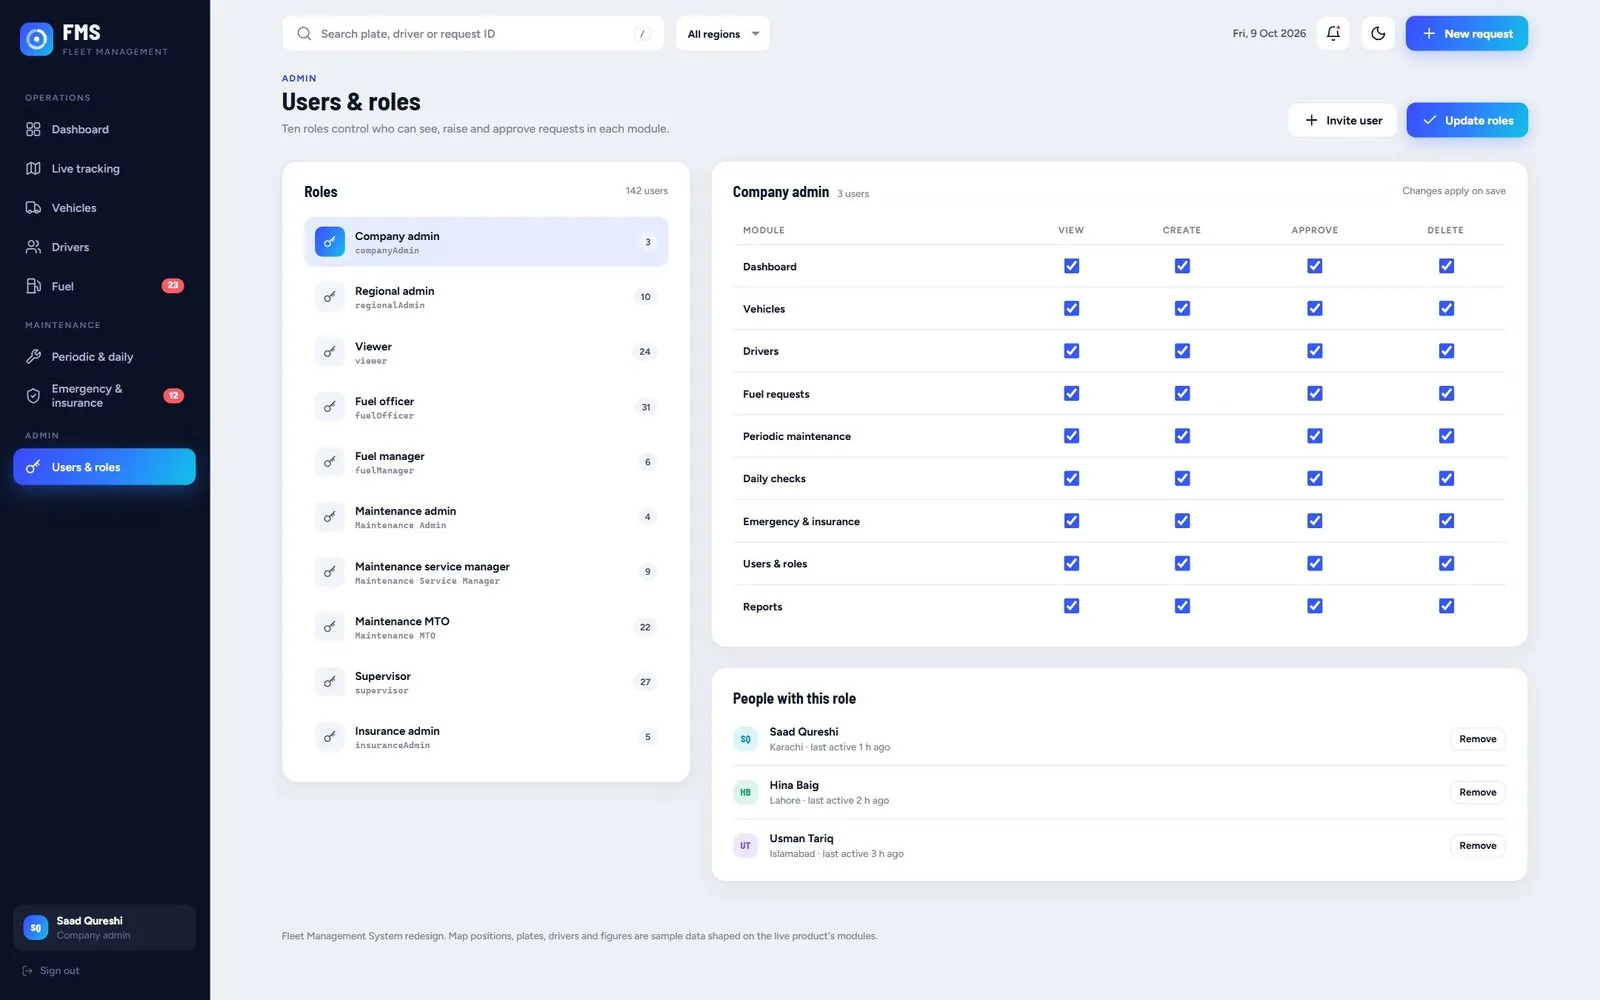
- Role-based access for regional heads, supervisors, technicians and drivers.
stack.md
The tech stack, and why we used it
React and Next.jsOne dashboard for each role, built from shared components over one data model.Node.js with real-time APIsPushes vehicle status to the map as it changes, instead of a daily report.MySQL and PrismaFuel, maintenance and job records are relational, so a strict database and typed queries fit them.Tailwind CSSKeeps a dense, data-heavy interface consistent across many screens.users.md
Who uses it
Head office
See 580+ vehicles live across 12+ cities and catch problems as they happen.
Four regional heads and supervisors
Run their region from a view built for their role.
Technicians and drivers
See their own jobs, schedules and assignments.
benefits.md
Benefits
- 35% higher employee efficiency.
- Fuel anomalies are flagged instead of found on paper later.
- Maintenance, insurance and emergency jobs are tracked to closure in one system.
cost.md
Cost benefits
- 38% lower fuel expenses.
- Scheduled maintenance replaces breakdowns found late on paper.
screens · 8
Every screen
Scroll sideways through the product.
Typography
Aa
Barlow Semi Condensed + Figtree
Barlow Semi Condensed fits plates, odometers and big KPIs into tight columns; Figtree keeps tables and forms friendly through a long shift.
colours
built with